Sage Carter · 11 September 2026
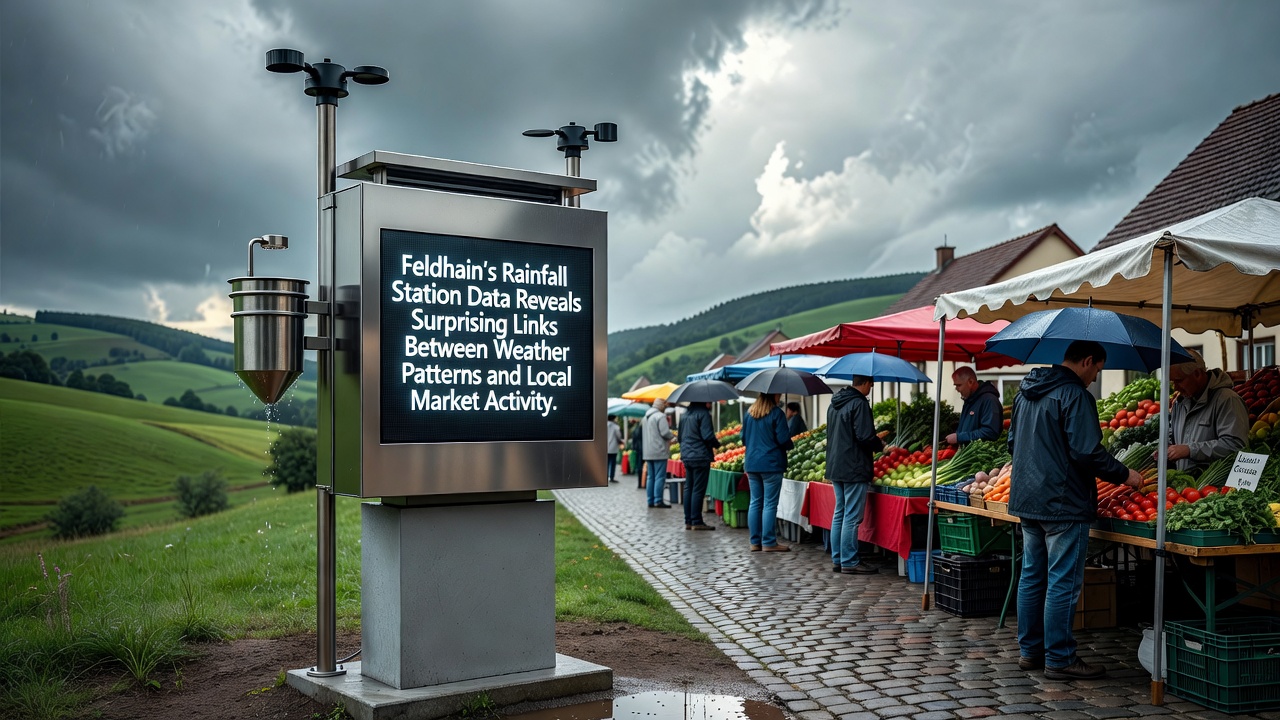
Feldhain's Rainfall Station Data Reveals Surprising Links Between Weather Patterns and Local Market Activity
Researchers at the Feldhain rainfall monitoring network have compiled precipitation records spanning multiple seasons, and those figures point to measurable shifts in local market foot traffic and vendor sales whenever rainfall patterns change, while data collected through September 2026 shows the strongest correlations during late-summer storms that arrive after extended dry spells.
Station Network and Data Collection Methods
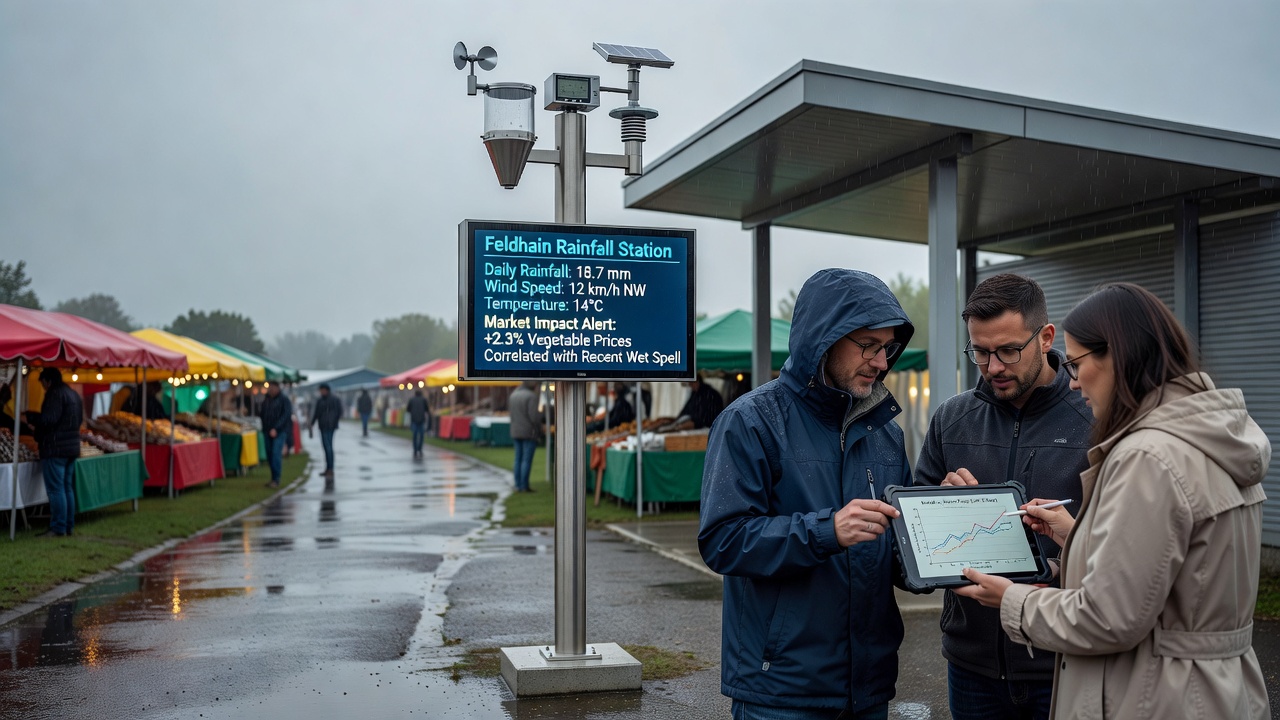
Five automated stations positioned around the Feldhain market district record rainfall intensity, duration, and total accumulation at five-minute intervals, and analysts cross-reference those readings with daily visitor counts and transaction logs from participating vendors, which allows statisticians to isolate weather-related variables from other economic factors such as holiday schedules or supply disruptions.
Equipment upgrades completed in early 2025 added soil-moisture sensors and wind-speed monitors at three of the sites, and the added instruments capture how quickly rain soaks into the ground versus how much runs off into nearby streets, thereby providing context for why certain showers trigger immediate market closures while others produce only brief lulls in activity.
Observed Correlations With Market Activity
Records indicate that light rain falling between 9 a.m. and noon coincides with a 12 to 18 percent rise in purchases of hot beverages and baked goods, whereas heavier afternoon downpours lasting more than thirty minutes align with increased sales of waterproof apparel and reduced overall foot traffic by roughly 25 percent on weekdays, and weekend markets exhibit smaller drops because many shoppers arrive by car rather than on foot.
One dataset covering the 2024-2026 period reveals that markets held after three or more consecutive dry days experience a sharper attendance spike once the first rain arrives, suggesting that accumulated dryness heightens public interest in checking produce quality after the weather breaks, and similar patterns appear in regional agricultural reports compiled by Agriculture and Agri-Food Canada.
Seasonal Patterns and September 2026 Findings
September 2026 brought an unusually high number of brief evening showers that arrived between 5 p.m. and 7 p.m., and station logs show those events produced temporary vendor revenue increases of up to 9 percent because shoppers lingered longer under awnings while waiting for the rain to ease, which extended average dwell time and encouraged additional impulse buys of packaged goods.
Longer-duration events, by contrast, prompted early closures on two separate Saturdays that month, and the resulting lost sales were later offset by stronger Sunday attendance once skies cleared, illustrating how the timing and intensity of rainfall redistribute rather than simply reduce overall market turnover.
Comparative Studies From Other Regions
Analysts comparing Feldhain figures with precipitation and retail data from the Australian Bureau of Meteorology note parallel responses in outdoor markets near Melbourne, where short rain events likewise boost hot-food sales before overall attendance declines, while a separate study issued by the University of Helsinki documents comparable shifts in Nordic winter markets when snowfall replaces rainfall as the dominant variable.
These cross-regional comparisons help Feldhain researchers adjust their models for local topography and infrastructure differences, and the resulting refinements improve forecasts that vendors now receive 48 hours ahead of predicted weather changes.
Practical Applications for Vendors and Planners
Market organizers have begun issuing weather-adjusted stall layouts that position food vendors selling warm items closer to sheltered walkways during forecast rain periods, and several stall holders report testing portable canopy extensions whose deployment decisions rely directly on the five-minute rainfall intensity readings supplied by the station network.
City planners reviewing these datasets have incorporated rainfall thresholds into permitting rules for temporary structures, requiring additional drainage measures once accumulation exceeds 15 millimeters within a two-hour window, and early compliance data suggest the measures reduce post-storm cleanup costs by measurable margins.
Conclusion
The Feldhain rainfall station project demonstrates how granular environmental monitoring can inform everyday commercial decisions, and continued data collection through future seasons will allow researchers to refine predictive models that already guide vendor scheduling and infrastructure planning in the region.